Conducting a Water Application Uniformity Evaluation for a Micro Irrigation System in the Nursery
DOWNLOADJune 28, 2012 - Tom Fernandez and Thomas A. Dudek
 Print
Print Email
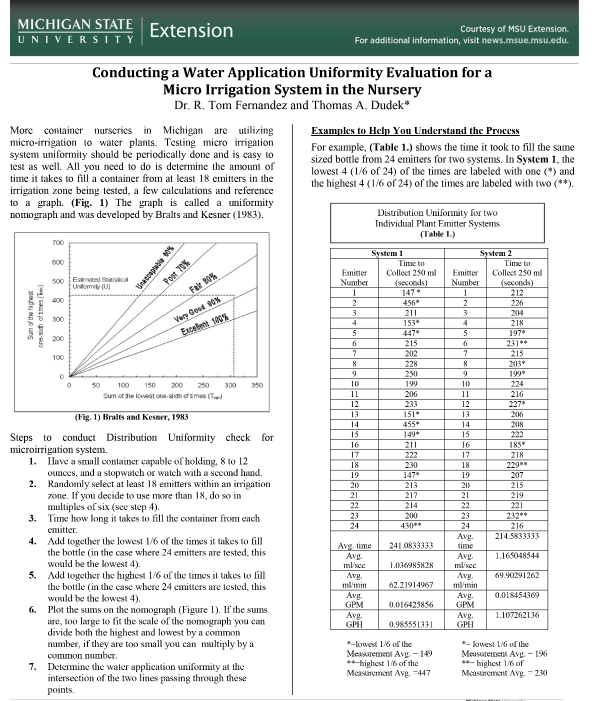
EmailMore container nurseries in Michigan are utilizing micro-irrigation to water plants. Testing micro irrigation system uniformity should be periodically done and is easy to test as well. All you need to do is determine the amount of time it takes to fill a container from at least 18 emitters in the irrigation zone being tested, a few calculations and reference to a graph. (Fig. 1) The graph is called a uniformity nomograph and was developed by Bralts and Kesner (1983).
Steps to conduct Distribution Uniformity check for microirrigation system.
- Have a small container capable of holding, 8 to 12 ounces, and a stopwatch or watch with a second hand.
- Randomly select at least 18 emitters within an irrigation zone. If you decide to use more than 18, do so in multiples of six (see step 4).
- Time how long it takes to fill the container from each emitter.
- Add together the lowest 1/6 of the times it takes to fill the bottle (in the case where 24 emitters are tested, this would be the lowest 4).
- Add together the highest 1/6 of the times it takes to fill the bottle (in the case where 24 emitters are tested, this would be the lowest 4).
- Plot the sums on the nomograph (Figure 1). If the sums are, too large to fit the scale of the nomograph you can divide both the highest and lowest by a common number, if they are too small you can multiply by a common number.
- Determine the water application uniformity at the intersection of the two lines passing through these points.
Examples to Help You Understand the Process
For example, (Table 1.) shows the time it took to fill the same sized bottle from 24 emitters for two systems. In System 1, the lowest 4 (1/6 of 24) of the times are labeled with one (*) and the highest 4 (1/6 of 24) of the times are labeled with two (**).
*=lowest 1/6 of the Measurement Avg. = 149
**=highest 1/6 of the Measurement Avg. =447
*= lowest 1/6 of the Measurement Avg. = 196
**= highest 1/6 of Measurement Avg. = 230
Distribution Uniformity for two Individual Plant Emitter Systems (Table 1).
| System 1 | System 2 | ||
|---|---|---|---|
| Emitter Number | Time to Collect 250 ml (seconds) | Emitter Number | Time to Collect 250 ml (seconds) |
| 1 | 147 * | 1 | 212 |
| 2 | 456* | 2 | 226 |
| 3 | 211 | 3 | 204 |
| 4 | 153* | 4 | 218 |
| 5 | 447* | 5 | 197* |
| 6 | 215 | 6 | 231** |
| 7 | 202 | 7 | 215 |
| 8 | 228 | 8 | 203* |
| 9 | 250 | 9 | 199* |
| 10 | 199 | 10 | 224 |
| 11 | 206 | 11 | 216 |
| 12 | 233 | 12 | 227* |
| 13 | 151* | 13 | 206 |
| 14 | 455* | 14 | 208 |
| 15 | 149* | 15 | 222 |
| 16 | 211 | 16 | 185* |
| 17 | 222 | 17 | 218 |
| 18 | 230 | 18 | 229** |
| 19 | 147* | 19 | 207 |
| 20 | 213 | 20 | 215 |
| 21 | 217 | 21 | 219 |
| 22 | 214 | 22 | 221 |
| 23 | 200 | 23 | 232** |
| 24 | 430** | 24 | 216 |
System 1:
Avg. time 241.0833333
Avg. ml/sec 1.036985828
Avg. ml/min 62.21914967
Avg. GPM 0.016425856
Avg. GPH 0.985551331
System 2:
Avg. time 214.5833333
Avg. ml/sec 1.165048544
Avg. ml/min 69.90291262
Avg. GPM 0.018454369
Avg. GPH 1.107262136
The sum of the lowest four times for System 1 is 149 seconds and the sum of the highest 4 times for system 1 is 447 seconds. Plotting these 2 points on the nomograph shows the distribution uniformity is in the poor range (60 - 70%). The sum of the lowest four times for System 2 is 149 seconds and the sum of the highest 4 times for system 2 is 230 seconds. Plotting these 2 points on the nomograph shows the distribution uniformity is in the excellent range (90 - 100%).
System 2 is in very good shape and nothing needs to be done except to periodically recheck to ensure distribution uniformity is maintained. System 1 needs to be fixed. Several things can be causing problems in System 1, such as:
- Inadequate irrigation system operating pressure for the nozzles being used. Emitters come with pressure specifications and operating outside of specified ranges can result in poor distribution uniformity. Pressure compensating emitters can help but still have specific pressure ranges for proper water delivery. If the pump is supplying too much or too little pressure, the emitters will not perform properly. Adjusting the delivery pressure at the pump will solve this problem. If the pump pressure has to be high to supply other irrigation blocks in-line pressure reducers can be used and are inexpensive. If the pump pressure cannot be increased further, the irrigation block is too large and should be split into smaller blocks.
- Improper selection of emitters. Instead of adjusting the pump, pressure different emitters can be selected with pressure specifications that fit what the pump delivers. Also, all emitters within a block should ideally be from the same manufacturer with the same delivery rate (the same model).
- Changes in system components over time. Emitter orifices wear, pumps become less efficient, pressure regulators fail. Proper maintenance is essential and components should be serviced or replaced when they no longer meet specifications. Emitters are the easiest and least expensive to replace and will change more rapidly than other system components. Since you know the time to fill, a given volume from your measurements you can see if this is the delivery rate specified by the emitter. To determine the gallons per hour (GPH) being delivered by the emitters you measured divide the ounces you collected by the time it took to collect, multiply by 3600 to convert seconds to hours and divide by 128 to convert ounces to gallons. For emitter 1, System 2 this would be: 10 / 226 * 3600 / 128 = 1.24 GPH
- Emitter clogging. Emitters are clogged with a variety of objects from sand and mineral deposits to insects. Sometimes you can easily see what is clogging the emitter and easily remove the item with a wire or by taking the nozzle off and cleaning it. However, since most emitters are plastic, cleaning will cause additional wear.
- Browsing. Yes, even irrigation is not immune; animals have been known to chew on emitters.
- In-line filters. Some emitters have filters, clean these out regularly.
- Wind has very little effect on most microirrigation but can affect spray stakes and other spray type systems to some degree.
- Improper selection of pipe diameters. This is the most expensive mistake to remedy. Replacing above-ground pipe is relatively inexpensive but replacing buried pipe is costly. In some cases, minor changes in system design can solve the problem.
Even though properly designed microirrigation systems are much more efficient than large volume overhead irrigation, distribution uniformity is still important. An irrigation system that does not provide water uniformly will result in over-watering some plants and under-watering others leading to poor plant health. Proper uniformity will also help with water conservation even in efficient microirrigation systems. Distribution uniformity is easy to test and should be done twice a year. Testing distribution uniformity does not replace regular checking to ensure emitters are not clogged and other routine checking.
References
Bralts, V.F. and C.D. Kesner. 1983. Drip irrigation field uniformity estimation. Trans. Of the Amer. Soc. Ag. Eng. 26:1369-1374
Haman, D.Z., A.G. Smajstrla and D.J. Pitts. 1997. Uniformity of sprinkler and microirrigation systems for nurseries. Bulletin 96-10:1-7, Fla. Coop. Ext. Ser., Univ. of Fla., Gainesville, Fla.
Haman, D.Z. and T. H. Yeager. 1998. Field evaluation of container nursery irrigation systems: Measuring uniformity of water application of microirrigation systems. Fact Sheet FS98-1, Fla. Coop. Ext. Ser., Univ. of Fla., Gainesville, Fla.