


Precision agriculture: Soil mapping and measuring with a data-driven approach
 Print
Print Email
EmailDigital tools make it easier to visualize how soil properties vary across our fields. Recent research suggests that using management zones to highlight these spatial patterns can help us understand field variations and how to better manage them.
Healthy soils are alive
Soil is the foundation of all plant growth and the lifeblood of modern agriculture. For thousands of years, nature has shaped soil to help life grow and produce abundant harvests. Recently, the importance of soil health has gained more attention, as research shows that healthy soils are better equipped to withstand environmental stresses. By analyzing the soil’s chemical and physical properties, farmers can ensure a balance of nutrients and fertility, promoting robust and productive crops.
The data associated with soils is commonplace on the modern farm. These can come from sampling and laboratory analysis and are visualized as soil maps. Many farmers are familiar with these data and their value to specific operations in applying optimal amounts of phosphorus (P), potassium (K), lime and micronutrients. Establishing management zones before sampling is critical to ensure that results are valid and accurate. Effective sampling requires careful consideration of spatial variations within the field to avoid inefficiencies and unnecessary costs. Outlined in this article are different ways to visualize these spatial patterns.
Static soil maps and visualizing the spatial patterns throughout the fields
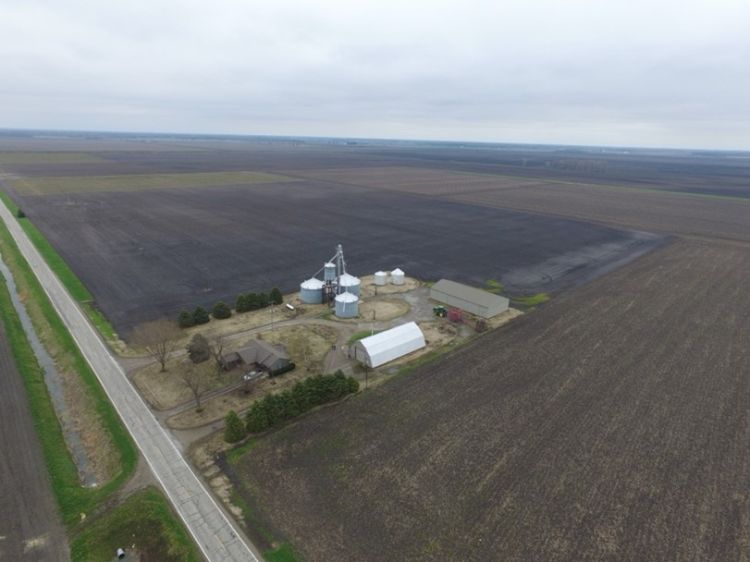
Soil maps are available for the entire continental U.S. through the National Resource Conservation Services (NRCS) web soil survey. These static maps are a digitized format of the soil survey booklets historically found at the Farm Service Agency locations across the state. From the maps, the Soil Survey Geographic Database (SSURGO) provides mapping units that contain information such as taxonomic classification, slopes, soil texture, drainage classification and other data collected by the NRCS in the past century. Available on the web, these data can be viewed through a browser on your desktop, tablet or mobile device and are also available for download, which delivers the data in a shapefile format. These data serve as a strong baseline and starting point that accurately reflect spatial patterns across the field. The defined zones reveal important insights into field variability, helping improve the understanding of soil conditions.
Soil sampling analysis
Beyond SSURGO maps, it's important to recognize that these dynamic, living systems, serve as a habitat not only for the plants that we cultivate but also for a diverse community of microbes, fungi and microorganisms. They play a crucial role in agriculture by driving the processes like nutrient cycling, decomposition, and creating essential soil structure that supports healthy plant growth. Therefore, a zonal sampling approach to collect soil samples is an accepted practice for most row-crop farmers.
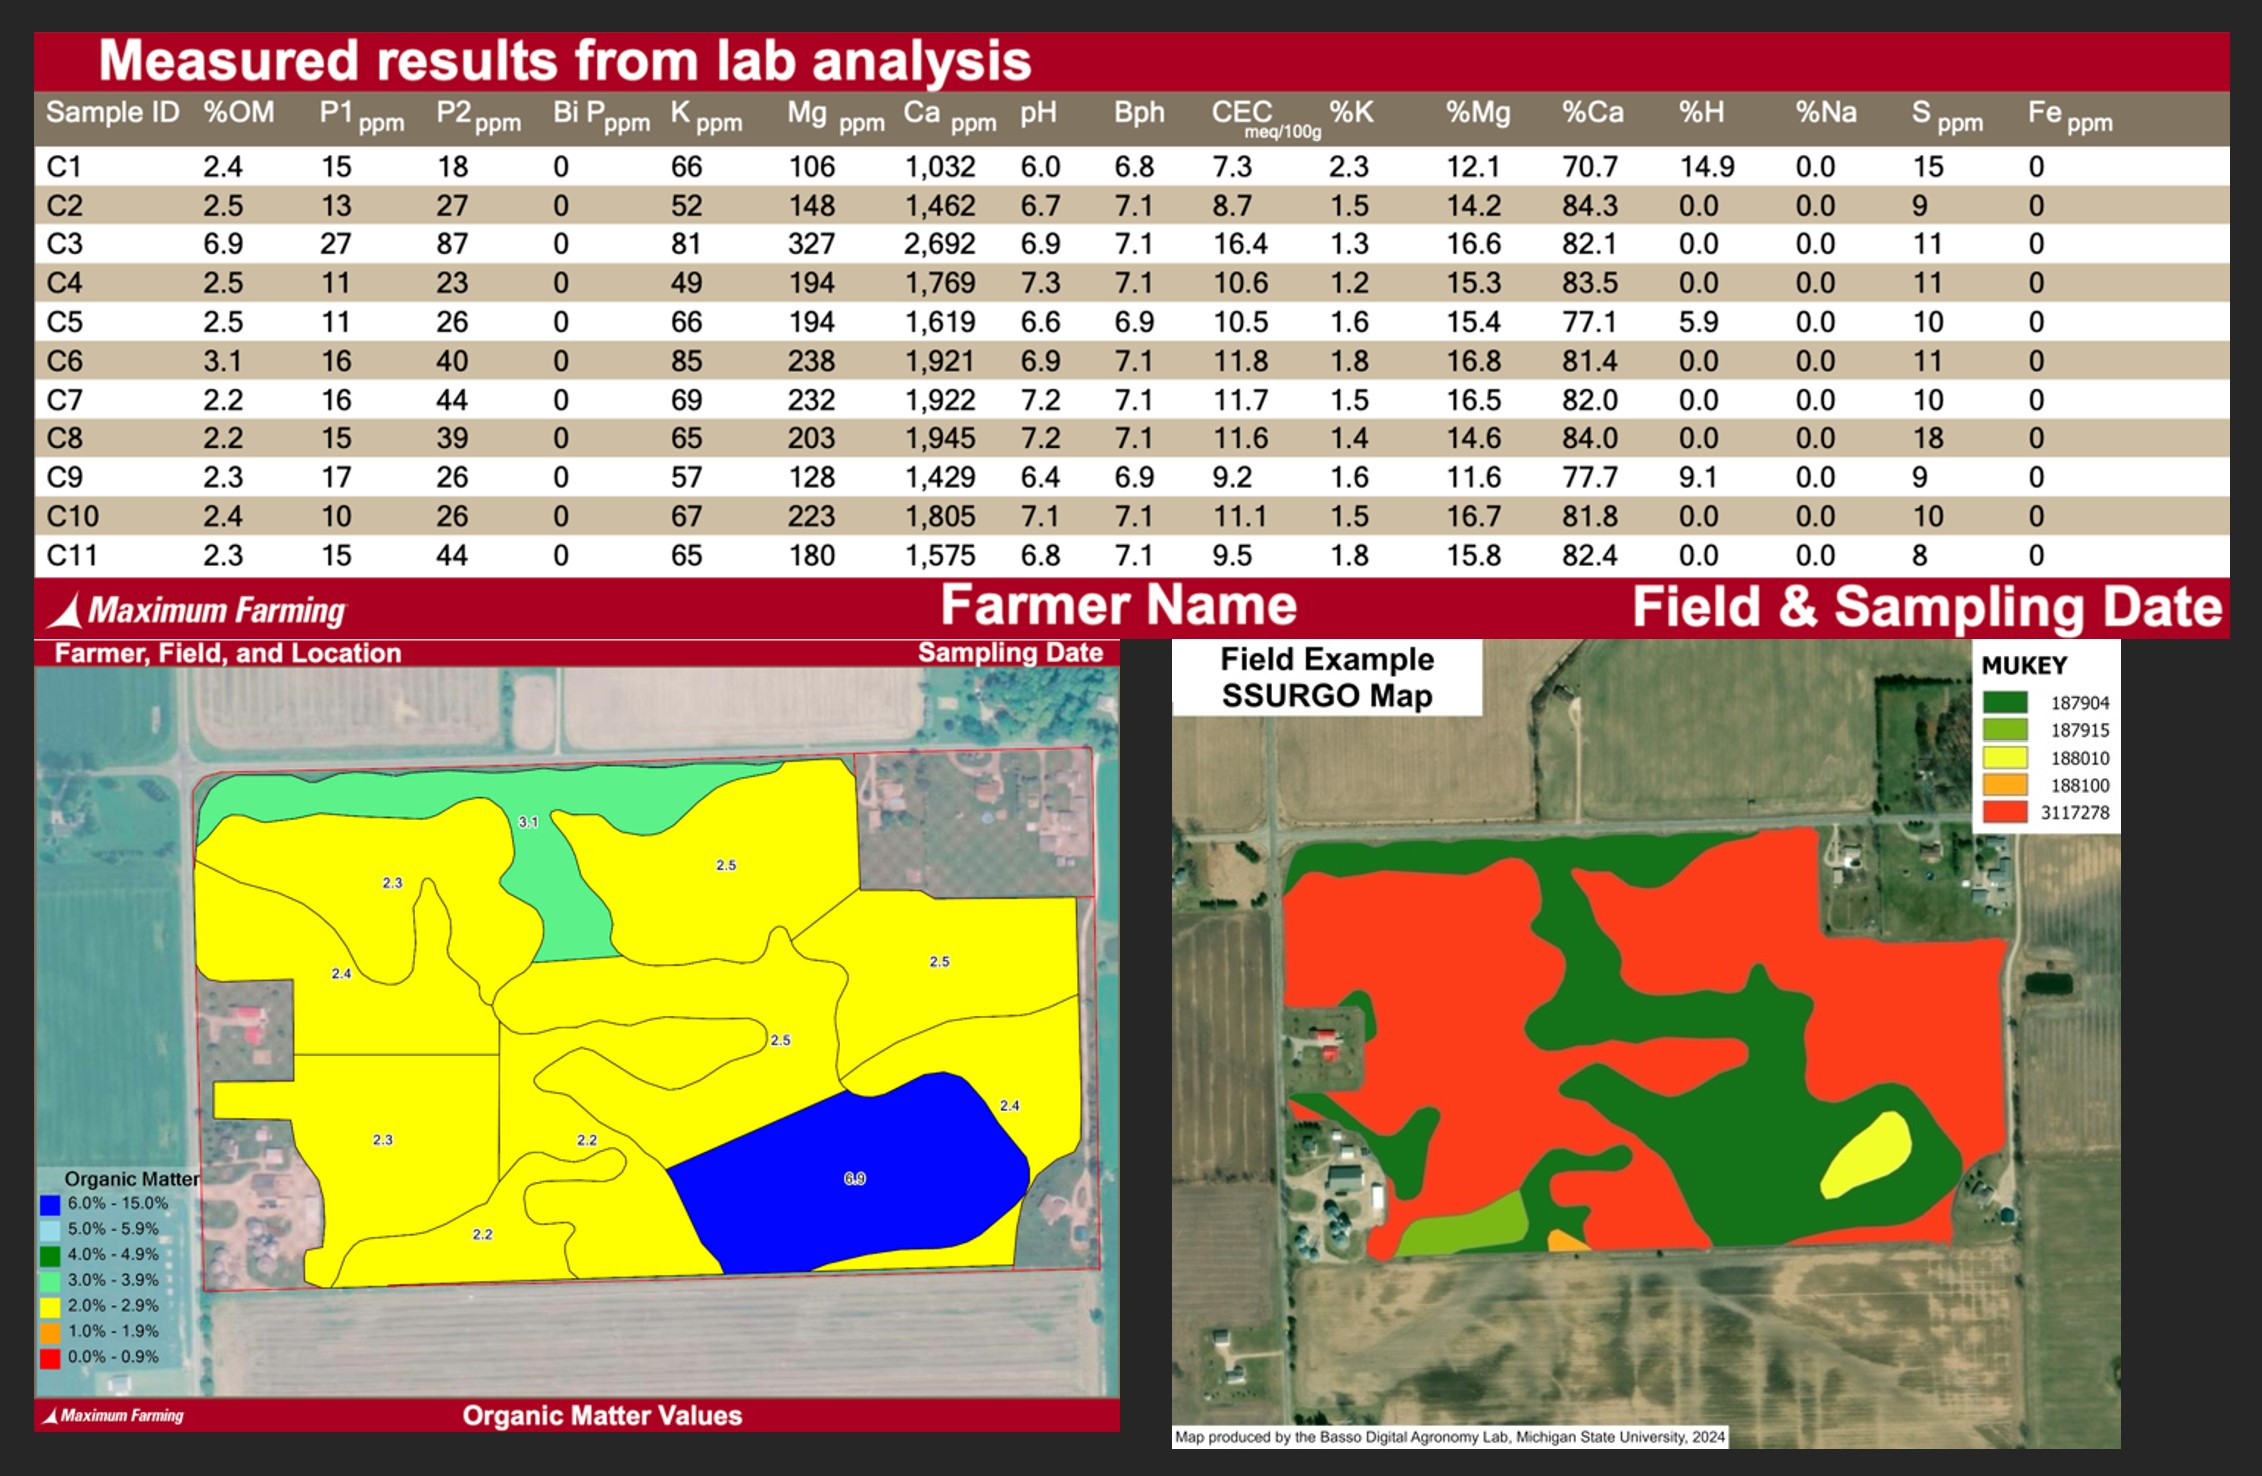
The MSU Soil Fertility and Nutrient Management Program provides online resources related to more specific research conducted by its lab. Soil test results from analytical labs come in different formats, usually as PDFs with tables showing levels of measured attributes (Figure 2, top). Sometimes the maps of these results printed on paper provide a pretty picture (Figure 2, bottom left); however, they’re hard to utilize for within-field management and difficult to further analyze with additional spatial datasets like yield maps. The samples collected in the field below used SSURGO (Figure 2, bottom right) as a baseline map and split/combine some zones. Research suggests that data from combined grain yield monitors can be used to delineate management zones, called Yield Stability, which in turn describes relative crop productivity. These zones proved to be strong predictors of field-scale variations in yields and similar patterns emerged when evaluating soil health metrics like soil organic carbon and Solvita soil health score.
Next steps to action
Developing a comprehensive understanding soil test results is an essential first step in leveraging these tools to make more informed decisions. Visualizing spatial patterns of potential deficiencies can help address problem areas effectively. Adjusting pH with lime, and managing phosphorus, potassium and micronutrients can be achieved by spatially varying nutrient applications based on the results of soil sampling. Coming soon from MSU Extension’s Precision Agriculture website will be a tool that will allow the user to input their soil test results and get variable rate recommendations following Bulletin 974, Tri-State Fertilizer Recommendations for Corn, Soybean, Wheat, and Alfalfa.